AI Search
How to Prove AI Visibility ROI to Executives
Branddi · Published on
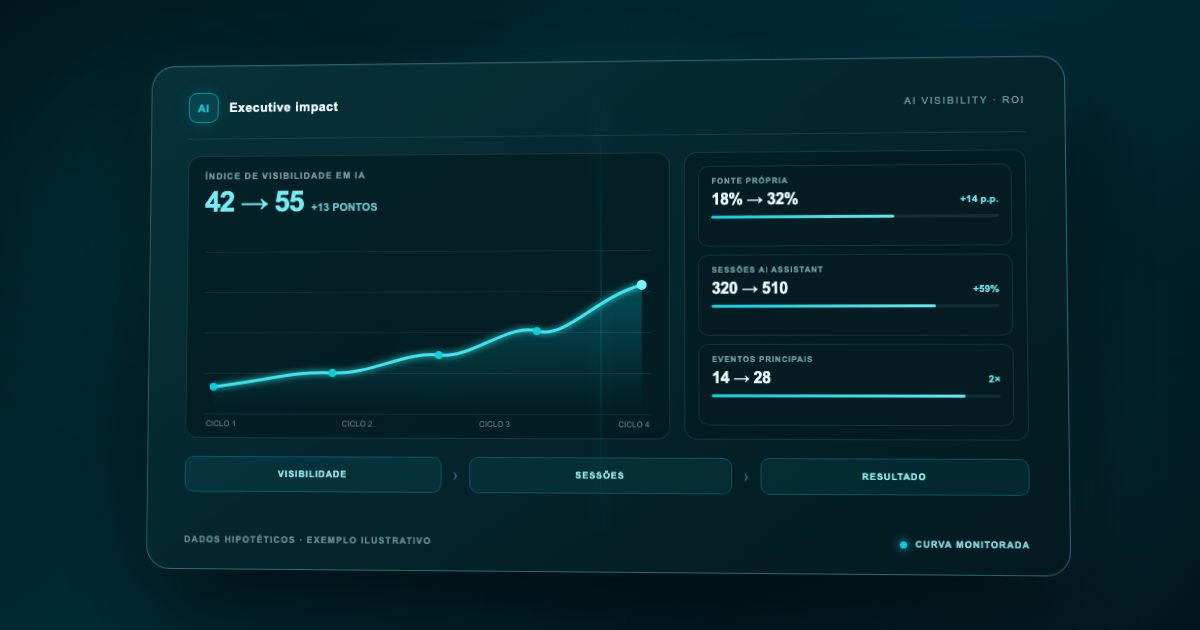
To prove the ROI of AI Visibility to executives, connect three layers without skipping steps: the AI Visibility Index curve, the brand's movement in the Presence Matrix, and results recorded in analytics, CRM, and finance. Visibility growth is a leading indicator; financial ROI exists only when attributable incremental margin and total investment are known.
What does AI Visibility ROI mean?
AI Visibility ROI is the relationship between the economic gain attributable to initiatives that improve a brand's presence in AI answers and the investment required to execute them. It is not simply an increase in mentions across ChatGPT, Gemini, or Google AI Mode.
That distinction prevents claims the data cannot support. A brand may gain presence in the text and owned-source citations without receiving an immediate click. It may also generate AI-influenced sessions and leads without all that value appearing in last-click reporting. The executive report should therefore show a chain of evidence:
AI Visibility Index → Presence Matrix → AI Assistant sessions → key events → pipeline → revenue → margin
Each step answers a different question. Did visibility change? Did the quality of that presence improve? Was there measurable behavior on the website? Did that behavior contribute to opportunities and sales? What economic value can be assigned under a declared attribution rule?
Which metrics belong in the executive report?
Separate leading indicators from business indicators. The first group shows whether the brand is earning space in AI answers; the second shows whether that change is reaching the commercial funnel.
- Layer — Metric — Executive interpretation
- AI Visibility — AI Visibility Index — Comparable change across monitored questions
- AI Visibility — Presence in the text — How often the brand appears in the answer
- AI Visibility — Owned source — How often official channels support the answer
- AI Visibility — Share among brands — The brand's share against competitors on the benchmark
- AI Visibility — Position of first citation — How early the brand appears
- AI Visibility — Selected brand — How often the brand is chosen or recommended
- Business — AI Assistant sessions — Identifiable visits originating from AI assistants
- Business — Key events — Valuable actions configured in GA4
- Business — Qualified leads — Contacts that meet the defined commercial criteria
- Business — Influenced pipeline — Opportunities whose journey included AI Search
- Business — Closed revenue — Sales that were actually completed
- Financial — Incremental margin — Economic value after variable costs under the attribution rule
The AI Visibility Index can combine four components: presence in the text, owned source, share among brands, and position of the first citation. In Branddi's methodology, their respective weights are 45, 25, 20, and 10, producing an index from 0 to 100. This formula is a comparative monitoring benchmark, not an official score issued by AI platforms.
Why should AI Visibility be presented as a curve?
One answer is an unstable snapshot. Platforms, sources, and wording change, so AI Visibility is not one number—it is a curve. The method should repeat the same base questions under comparable conditions, record the rendered page or screen, and preserve the evidence. Each cycle adds a new point to the series.
The recommended workflow is Curation → Repeated execution → On-screen measurement → Comparison → Action and rereading → Continuous monitoring. This discipline separates a sustained movement from a one-off fluctuation.
To build a stable question set, see How to monitor your brand in ChatGPT. For the complete benchmark, read AI Visibility: how to measure whether ChatGPT, Google AI Mode, and Gemini recommend your brand.
How does the Presence Matrix improve the ROI narrative?
The index shows direction and intensity; the Presence Matrix explains the quality of the position earned. It separates four situations:
- Presence with an owned source: the brand appears and an official channel supports the answer.
- Dependent presence: the brand appears but relies on third parties to be explained.
- Source without visibility: the owned channel is cited, but the brand does not gain proportional presence in the text.
- Absence: neither meaningful brand presence nor an owned source appears.
Moving questions from absence to dependent presence is progress, but it does not have the same strategic value as earning presence with an owned source. Likewise, presence is not recommendation. A brand may be cited yet lose the podium, appear after competitors, or receive a consequential “but” in the answer's strengths and caveats.
This context protects executives from superficial conclusions. The goal is not to maximize mentions indiscriminately, but to improve presence in questions that shape discovery, trust, attributes, profile and occasion, purchase channel, customer service, cancellation, and refunds.
How do you connect visibility to GA4?
In GA4, use the Traffic acquisition report to track sessions identified as AI Assistant and analyze what happens after the click. Google's official documentation explains the report at https://support.google.com/analytics/answer/12923437?hl=en, accessed September 3, 2026.
Then assess the relevant key events, such as a form submission, demo request, signup, or purchase. The official definition is available at https://support.google.com/analytics/answer/9267568?hl=en, and the procedure for marking an event as a key event is at https://support.google.com/analytics/answer/13128484?hl=en, both accessed September 3, 2026.
GA4 does not measure every exposure in AI answers. Someone may read a recommendation, remember the brand, and return later through organic search, direct traffic, or paid media. Some interfaces also do not preserve the click source. AI Assistant sessions are therefore identifiable traffic, not the full influence of AI Search. See How to measure traffic from ChatGPT, Gemini, and Perplexity in GA4 for the implementation details.
How do you connect GA4, CRM, and revenue without inflating results?
Define the rule before viewing the outcome. In GA4, record sessions and key events. In the CRM, preserve source, date, landing page, and contacts linked to each opportunity. In finance, use closed revenue and confirmed margin.
Present at least three views:
- Direct: an AI Assistant session generated the key event or conversion within the defined window.
- Influenced: AI Search participated in the journey, although another channel closed the conversion.
- Incremental: the estimated difference between the observed result and a baseline or comparable group.
Attribution models distribute credit among touchpoints, but they do not prove causality by themselves. Google describes attribution scopes and models at https://support.google.com/analytics/answer/10596866?hl=en, accessed September 3, 2026.
Do not present influenced pipeline as revenue. Pipeline is potential value and should be shown with stage, probability, and influence rule. Also, do not add direct and influenced revenue as if they were independent sets; the same sale may appear in both views.
Which formula should you use for ROI?
Use margin, not gross revenue:
ROI = (attributable incremental margin − total investment) ÷ total investment × 100
Total investment should include technology, monitoring, diagnosis, content creation and updates, development, data, and the hours of the teams involved. Attributable incremental margin should follow the approved rule for the period and deduct applicable variable costs.
Illustrative example with hypothetical data
Consider an operation that changes as follows after comparable monitoring cycles:
- Metric — Before — After
- AI Visibility Index — 42 — 55
- Owned source — 18% — 32%
- AI Assistant sessions — 320 — 510
- Key events — 14 — 28
These figures are hypothetical and provided only to illustrate the method. They describe a coherent chain: a better curve, stronger owned-source support, more identifiable sessions, and more valuable actions. They are still insufficient to calculate financial ROI.
Suppose, again only as an illustration, that CRM and finance analysis attributes $72,000 in incremental margin to the initiative, with a total investment of $40,000 during the period. The result would be:
ROI = ($72,000 − $40,000) ÷ $40,000 × 100 = 80%
The executive slide must disclose the period, baseline, window, attribution model, included costs, and confidence level. Without them, “80%” appears precise but is not auditable.
How should a one-page executive dashboard be structured?
Organize it into five blocks:
- Thesis: the questions and business decisions prioritized.
- Curve: the AI Visibility Index and its four components over time.
- Matrix: how many questions moved to presence with an owned source and how many remain in critical absence.
- Funnel: AI Assistant sessions, key events, qualified leads, pipeline, and closed revenue.
- Economics: incremental margin, investment, ROI, limitations, and next action.
Include competitors on the benchmark and the source diet—owned channel, competitor, reputation, independent content, press, institutional, platform, and Social/UGC—when they explain why the brand leads, loses, or remains absent. Use selected evidence to support the interpretation without placing every screenshot in the main presentation.
What decision should executives make from this report?
A useful report does not end with the score. It indicates where to act: strengthen an official source, address a recurring caveat, pursue a source opportunity, close a reputation gap, or improve the page receiving qualified traffic.
When a competitor is recommended first, identify the questions where it leads and the sources supporting that advantage. See How to identify competitors recommended ahead of your brand.
Executives should leave with a decision about priority, budget, owner, deadline, and the next rereading cycle. That is what turns AI Visibility from an interesting score into a management system.
How long does it take to prove ROI?
There is no universal period. The analysis must include enough cycles to form a curve and respect the length of the commercial funnel. Fast transactions may produce learning in weeks; long B2B cycles require months.
Does an increase in the AI Visibility Index prove revenue?
No. The index is a leading indicator. It acquires financial meaning when the analysis connects visibility, behavior, opportunity, sale, and margin under explicit rules.
Can pipeline be used to calculate ROI?
Pipeline can show potential or influence, but it should not be treated as realized revenue. For financial ROI, prefer the margin from closed deals and a defensible incremental estimate.
How do you make the evidence auditable?
Preserve the question, real answer, date, platform, language, country, rendered page or screen, and cited sources. When appropriate, archive the evidence with a SHA-256 hash to demonstrate file integrity.
Proving AI Visibility ROI requires a disciplined narrative: curve, quality of presence, and business outcome. Branddi AI Visibility organizes the continuous monitoring, evidence, and competitive analysis needed to turn AI answers into executive decisions.
Official sources
- https://support.google.com/analytics/answer/12923437?hl=en, accessed September 3, 2026.
- https://support.google.com/analytics/answer/10596866?hl=en, accessed September 3, 2026.
- https://support.google.com/analytics/answer/9267568?hl=en, accessed September 3, 2026.
- https://support.google.com/analytics/answer/13128484?hl=en, accessed September 3, 2026.
Related articles
-
How to Measure Traffic from ChatGPT, Gemini, and Perplexity in GA4
Learn how to identify visits from ChatGPT, Gemini, and Perplexity in GA4, compare platforms, and measure engagement, key events, and attribution limits.
-
Is ChatGPT Getting Your Brand Wrong? How to Fix It
Learn how to investigate incorrect information about your company in ChatGPT, correct public sources, and track whether answers change with evidence.
-
How to monitor your brand in ChatGPT: a question set
Monitor your brand in ChatGPT with a fixed question set, a reusable record template and weekly comparisons of mentions, sources and recommendations.
-
How to compare your brand and competitors in AI answers
Compare brands in AI answers using confirmed competitors, separate signals and clear denominators. Learn how to interpret sources and order.
-
AI Visibility: how to measure and evaluate a solution
Compare AI Visibility solutions through coverage, sources, evidence, and history. Learn what to request when assessing how AI answers present your brand.